


Refrigeration Equipment ROI and Investment Analysis: Maximizing Returns in 2025
Investing in refrigeration equipment represents one of the largest capital expenditures for foodservice operations, making refrigeration equipment ROI analysis crucial for business success. Understanding the total cost of ownership, operational benefits, and financial returns of commercial cooling investment helps operators make informed decisions that maximize profitability. This comprehensive analysis examines how to evaluate cold storage ROI and optimize your refrigeration investments.
1. Understanding Refrigeration Investment Components
1.1 Initial Capital Investment
Equipment Costs
Commercial refrigeration equipment pricing breakdown:
Walk-In Coolers: - Small (6x8 feet): $8,000-$15,000 - Medium (8x10 feet): $12,000-$22,000 - Large (12x16 feet): $18,000-$35,000 - Extra Large (16x20+ feet): $25,000-$50,000+
Reach-In Refrigeration: - Single Door: $2,500-$5,000 - Two Door: $4,500-$8,500 - Three Door: $6,500-$12,000 - Glass Door Units: Premium 15-25% over solid doors
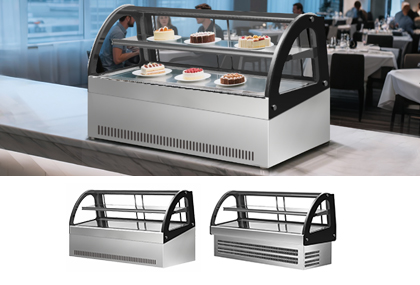
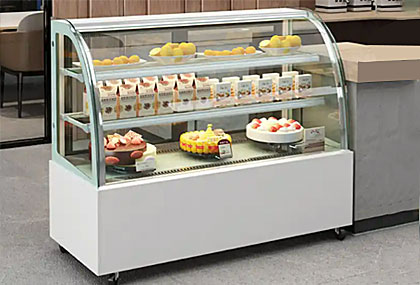
Display Cases: - Cake Display Cases: $3,000-$15,000 - Deli Cases: $5,000-$20,000 - Beverage Coolers: $2,000-$8,000 - Ice Cream Cabinets: $4,000-$18,000

Installation and Infrastructure
Total project costs beyond equipment:
Installation Services (10-20% of equipment cost): - Professional installation and setup - Electrical connections and modifications - Plumbing and drainage connections - Startup and commissioning
Supporting Infrastructure: - Electrical service upgrades: $1,000-$5,000 - Ventilation modifications: $500-$3,000 - Flooring and structural work: $1,000-$8,000 - Permits and inspections: $200-$1,000
1.2 Financing Considerations
Purchase vs. Lease Analysis
Financing options impact on ROI:
Cash Purchase Benefits: - Immediate depreciation benefits - No interest payments - Full ownership and control - Potential early payment discounts
Equipment Financing: - Preserve cash flow for operations - Fixed payment schedules - Potential tax advantages - Credit building opportunities
Lease vs. Buy Calculator
Financial comparison framework:
Total Cost of Ownership = Purchase Price + Interest + Maintenance - Residual Value Lease Total Cost = Monthly Payments × Lease Term + End-of-Lease Options
Break-Even Analysis: - Compare total costs over equipment lifespan - Consider depreciation and tax benefits - Evaluate flexibility and upgrade options - Assess maintenance responsibility differences
2. Operating Cost Analysis
2.1 Energy Consumption Impact
Energy Efficiency ROI
Energy-efficient refrigeration savings analysis:
Standard vs. Energy Star Comparison: - Standard Equipment: 15-25 kWh daily consumption - Energy Star Equipment: 10-18 kWh daily consumption - Potential Savings: 25-40% energy reduction - Annual Cost Impact: $800-$2,500 savings per unit
Real-World Energy Calculations
Walk-in cooler energy analysis (8x10 example):
Standard Efficiency Unit: - Daily consumption: 18-24 kWh - Monthly cost: $216-$288 (at $0.40/kWh) - Annual energy cost: $2,592-$3,456
High-Efficiency Unit: - Daily consumption: 12-16 kWh - Monthly cost: $144-$192 (at $0.40/kWh) - Annual energy cost: $1,728-$2,304 - Annual Savings: $864-$1,152
2.2 Maintenance Cost Considerations
Preventive Maintenance ROI
Maintenance investment vs. repair costs:
Annual Preventive Maintenance: - Quarterly Service: $150-$300 per visit - Annual Professional Cleaning: $200-$500 - Filter and Parts Replacement: $100-$300 - Total Annual Investment: $800-$1,500
Emergency Repair Avoidance: - Compressor Replacement: $1,500-$4,000 - Control System Repair: $300-$1,200 - Door Seal Replacement: $200-$600 - Average Annual Repair Costs: $500-$2,000 without maintenance
Service Contract Analysis
Service agreement value proposition:
Full Service Contract Benefits: - Predictable monthly costs - Priority service response - Parts and labor included - Preventive maintenance scheduling
Cost Comparison: - Full Service: $150-$400 monthly - Time & Materials: $125/hour + parts - Break-Even: 12-20 service hours annually
2.3 Food Safety and Loss Prevention
Product Loss Prevention ROI
Refrigeration failure cost impact:
Inventory Loss Scenarios: - Temperature Excursion: 10-50% product loss - Complete System Failure: 80-100% product loss - Average Inventory Value: $2,000-$15,000 per unit - Insurance Deductibles: $500-$2,500
Annual Loss Prevention Value: - Reduced Spoilage: $1,000-$5,000 annually - Extended Shelf Life: 15-30% longer product life - Quality Maintenance: Reduced customer complaints - Compliance Costs: Avoided health department violations
3. Revenue Enhancement Analysis
3.1 Sales Impact of Quality Refrigeration
Product Quality Improvement
Premium refrigeration sales benefits:
Visual Appeal Enhancement: - Display Case Lighting: 15-25% impulse purchase increase - Product Presentation: Improved customer perception - Temperature Consistency: Maintained product quality - Extended Display Time: Longer sales window
Customer Satisfaction Metrics: - Product Quality Scores: 10-20% improvement - Repeat Purchase Rates: 8-15% increase - Customer Complaints: 30-50% reduction - Word-of-Mouth Marketing: Enhanced reputation
Menu Expansion Opportunities
Refrigeration capacity enables growth:
New Product Categories: - Fresh Prepared Foods: Higher margin items - Grab-and-Go Options: Convenience sales - Seasonal Specialties: Limited-time offerings - Premium Ingredients: Upscale menu items
Revenue Increase Potential: - Menu Diversification: 10-25% sales increase - Higher Margin Items: 15-30% profit improvement - Reduced Waste: 5-15% cost savings - Competitive Advantage: Market differentiation
3.2 Operational Efficiency Gains
Labor Productivity Improvement
Efficient refrigeration reduces labor costs:
Time Savings Benefits: - Organized Storage: Faster product retrieval - Temperature Stability: Reduced monitoring time - Easy Cleaning Design: Simplified maintenance - Reliable Operation: Decreased troubleshooting
Quantified Labor Savings: - Daily Time Savings: 30-60 minutes per day - Labor Cost Reduction: $500-$1,500 monthly - Annual Labor Savings: $6,000-$18,000 - Productivity Increase: 5-12% efficiency gain
Inventory Management Efficiency
Modern refrigeration improves inventory control:
FIFO Implementation: - Organized Storage Systems: Better rotation practices - Clear Visibility: Easier inventory tracking - Temperature Zones: Optimized storage conditions - Reduced Waste: 10-25% inventory loss reduction
4. ROI Calculation Methodologies
4.1 Simple Payback Period
Basic Payback Formula
Refrigeration equipment payback calculation:
Payback Period = Initial Investment ÷ Annual Savings
Example Calculation: - Equipment cost: $15,000 - Installation cost: $2,500 - Total investment: $17,500 - Annual energy savings: $1,200 - Annual maintenance savings: $800 - Annual productivity gains: $3,000 - Total annual benefits: $5,000 - Payback period: 3.5 years
Factors Affecting Payback
Variables influencing payback calculations:
Positive Factors: - High energy costs in local area - Intensive equipment usage patterns - Premium product pricing opportunities - High labor costs for maintenance
Negative Factors: - Low energy costs - Seasonal business variations - Limited menu expansion opportunities - Existing efficient equipment
4.2 Net Present Value Analysis
NPV Calculation Framework
Long-term investment evaluation:
NPV Formula: NPV = Σ(Annual Cash Flow ÷ (1 + Discount Rate)^Year) - Initial Investment
10-Year NPV Example: - Initial investment: $20,000 - Annual savings: $4,000 - Discount rate: 8% - Equipment residual value: $2,000 - NPV: $6,843
Internal Rate of Return
IRR analysis for refrigeration investment:
IRR Calculation Factors: - Initial cash outflow - Annual cash flow benefits - Equipment lifespan - Residual value consideration
Typical IRR Ranges: - High-efficiency upgrades: 15-25% IRR - Capacity expansion: 12-20% IRR - Emergency replacements: 8-15% IRR
4.3 Total Cost of Ownership
Comprehensive TCO Analysis
15-year lifecycle cost evaluation:
Cost Components: - Initial Purchase: $20,000 - Installation: $3,000 - Energy (15 years): $35,000 - Maintenance: $15,000 - Repairs: $8,000 - End-of-life disposal: $500 - Total TCO: $81,500
Value Components: - Revenue enhancement: $75,000 - Cost savings: $45,000 - Residual value: $2,000 - Total value: $122,000 - Net benefit: $40,500
5. Risk Assessment and Mitigation
5.1 Investment Risk Factors
Technology Obsolescence Risk
Equipment lifecycle considerations:
Risk Mitigation Strategies: - Modular Design: Upgradeable components - Industry Standards: Proven technologies - Manufacturer Stability: Established brands - Service Availability: Long-term support
Market Change Risks
Business environment impacts:
Economic Factors: - Energy cost fluctuations - Labor cost changes - Food cost inflation - Regulatory modifications
Competitive Factors: - Market saturation - Consumer preference shifts - Technology disruption - New entrant competition
5.2 Risk Mitigation Strategies
Insurance and Warranty Protection
Risk transfer mechanisms:
Equipment Protection: - Extended Warranties: 3-7 year coverage options - Equipment Insurance: Breakdown coverage - Business Interruption: Revenue protection - Product Loss: Spoilage coverage
Operational Risk Management
System reliability enhancement:
Redundancy Planning: - Backup Systems: Secondary refrigeration - Emergency Procedures: Response protocols - Supplier Relationships: Quick replacement access - Preventive Maintenance: Failure prevention
6. Performance Monitoring and Optimization
6.1 Key Performance Indicators
Financial Metrics
ROI tracking measurements:
Primary KPIs: - Energy Cost per Unit Stored: Monthly tracking - Maintenance Cost per Hour Operation: Equipment efficiency - Revenue per Cubic Foot: Space utilization - Product Loss Rate: Quality maintenance
Return Metrics: - Actual vs. Projected Savings: Performance verification - Payback Progress: Timeline tracking - Cash Flow Impact: Monthly analysis - ROI Achievement: Annual evaluation
Operational Metrics
Performance monitoring indicators:
Efficiency Measures: - Temperature Stability: ±2°F variance - Energy Consumption: kWh per day - Uptime Percentage: >99% target - Service Response Time: <4 hours
6.2 Continuous Improvement
Performance Optimization
Ongoing enhancement strategies:
Regular Reviews: - Quarterly Performance Assessment: Metric analysis - Annual ROI Evaluation: Comprehensive review - Technology Updates: Upgrade consideration - Process Improvements: Operational efficiency
Optimization Opportunities: - Energy Management: Smart controls implementation - Preventive Maintenance: Schedule optimization - Capacity Utilization: Storage efficiency - Staff Training: Operational best practices
7. Industry Benchmarks and Best Practices
7.1 Industry ROI Standards
Typical Payback Periods
Refrigeration investment industry benchmarks:
Equipment Category Paybacks: - Energy Efficiency Upgrades: 2-4 years - Capacity Expansion: 3-6 years - New Restaurant Equipment: 4-8 years - Emergency Replacements: 5-10 years
Success Factors
High-ROI implementations characteristics:
Critical Success Elements: - Proper Sizing: Avoid over/under capacity - Quality Installation: Professional setup - Regular Maintenance: Preventive care - Staff Training: Proper operation
7.2 Best Practice Recommendations
Investment Decision Framework
Systematic evaluation process:
Decision Criteria: 1. Financial Analysis: ROI and payback calculations 2. Operational Requirements: Capacity and functionality needs 3. Quality Standards: Brand and certification requirements 4. Service Support: Local availability and responsiveness 5. Future Flexibility: Expansion and upgrade capabilities
Implementation Success Strategies
Maximizing ROI achievement:
Project Management: - Professional Planning: Detailed specifications - Qualified Installation: Certified technicians - Proper Commissioning: Performance verification - Staff Training: Operational procedures - Monitoring Systems: Performance tracking
Refrigeration equipment ROI analysis requires comprehensive evaluation of both costs and benefits over the equipment lifecycle. Successful commercial cooling investment decisions balance initial capital requirements with long-term operational benefits, energy savings, and revenue enhancement opportunities.
Focus on cold storage ROI optimization through careful equipment selection, professional installation, and proactive maintenance. Monitor performance against established benchmarks and continuously optimize operations to maximize returns. Remember that quality refrigeration equipment is not just a cost center but a profit driver that enhances product quality, operational efficiency, and customer satisfaction.
Consider working with experienced refrigeration professionals who can provide detailed refrigeration cost analysis specific to your operation. The right investment in quality equipment will deliver strong returns and support business growth for many years.
Most popular More «
-
BC Series Can-Shaped Beverage Coolers
-
Do Cakes Require Commercial Refrigerators?
-
Best EC50 Mini Beverage Cooler for Global Export
-
Guide to Floor-Standing Refrigerated Cabinets for Coffee Shops
-
Why Cooluma Focuses on the Mid-to-High-End Refrigerated Display Cabinet Segment?
-
How Many Pans Does a Gelato Display Freezer Hold?
-
Why Are Cooluma Cake Display Cabinets So Popular?
-
Commercial Bakery Display Case with Curved Glass
-
A Buying Guide for Cake Display Cabinets with Built-in Adjustable Layered Shelves
-
An Analysis of the Advantages of Stainless Steel Refrigerated Display Cabinets